

By Olev Edur
Statistics compiled by the Canada Revenue Agency provide a snapshot of the financial health of those 65 or older—and it’s generally better than you might think
How have Canadians 65 or older been doing lately when it comes to their financial security? The answer may surprise you: according to the latest data, while many retirees have been struggling to get by on modest incomes, particularly since the inflationary bout that followed the COVID-19 pandemic, the majority seem to be doing better than ever.
In late 2024, for example, during a parliamentary squabble over increasing Old Age Security (OAS) benefits for those aged 65 to 75, it was revealed that the median net worth of Canadians over 65 had risen to almost $550,000.
Similar surprises were contained in the most recent Canada Revenue Agency (CRA) final individual-income statistics for the 2021 taxation year. (These CRA statistics have unparalleled accuracy. Unlike polls or surveys, which base their conclusions on extrapolations from relatively small numbers of respondents and must rely on the unverifiable honesty of those respondents, the CRA data in- corporates “approximately 100 per cent”—the CRA’s wording—of all tax returns filed by Canadians for the year, and there are severe penalties for misrepresentation. The information is assembled into large groupings to strictly protect individual privacy.)
According to the CRA data, almost 7.25 million Canadians 65 or older filed tax returns and paid $52.6 billion in income tax for 2021. The following are some further findings:
Healthy Incomes for the Majority, But…
The average net income of all tax filers 65 or older was a healthy $48,798— not much lower than the average of $55,144 declared by 30 million Canadians of all ages for 2021. And, of course, while more recent CRA stats are not yet available, it can be safely assumed that these averages—including those for retirees—will have risen even further by now.
The stats also show, however, that almost two in five (38.7 per cent) seniors—about 2.8 million people— filed returns that were non-taxable. In other words, their incomes weren’t high enough to result in a tax liability.
While the data for these filers can’t be separated from the overall totals, it can be assumed that in the vast majority of cases (depending on the tax credits and deductions available), this would have translated into individual net incomes of less than $30,000; the average likely would have been considerably less.
This income dichotomy in turn means that, generously assuming the average net income among those 2.8 million seniors who filed non-taxable returns was, say, $25,000, the average net income among those 4.4 million seniors who filed taxable returns likely would have been closer to $65,000 than $49,000.
There’s also an income dichotomy between men and women. Of those 7.25 million tax-filing seniors, almost 3.9 million (54 per cent) were female, and 1.66 million (43 per cent) of these women filed non-taxable returns. In other words, the incidence of non-taxable incomes was significantly more prevalent among females than among males. And this disparity becomes more pronounced with age. Among seniors aged 80 or older, women outnumbered men by about 1.8 million to 1.1 million, and of these women, 47 per cent filed non-taxable returns.
Income Sources
The vast majority of seniors (94 per cent) each earned an average of $6,438 from Old Age Security (OAS) in 2021. Given that OAS is available to all Canadians who have lived here for more than 10 or 20 years (the residency requirements are somewhat complex) and that one can now defer OAS from the normal age of 65 until as late as age 70 to earn greater benefits, it may be assumed that the uptake rate is not closer to 100 per cent because some seniors are availing themselves of the deferral opportunity, and given the average income figures above, many are clearly not in immediate need of the income.
Some of the shortfall, however, will have represented senior taxpayers who did not yet meet the residency requirements.
Average earnings from the Canada/Quebec Pension Plan (CPP/QPP) were $8,221, but uptake was a bit lower, at 92 per cent of all tax filers 65 or older. This is because (a) you get benefits only if you’ve contributed to the Plan(s) and (b) as with OAS, some seniors will have deferred uptake until as late as age 70 to secure a bigger benefit.
More than one million seniors (14 per cent of all those 65 or older) continued to work and earn employment income during 2021, with the average income earned from this source being $42,104. As is to be expected, participation in the workforce declined with age—in the 65 to 69 age cohort, the participation rate was 30 per cent, whereas in the 80-plus cohort, it was a mere 0.2 per cent, or just 37,210 people.
Sixty per cent of seniors derived income from “other pensions,” which would include private pensions as well as RRIF/annuity income. What’s odd, however, is that almost 418,000 seniors declared an average of $13,077 in RRSP income for the year. Since you’re able to claim the $2,000 annual pension income credit on RRIF and annuity income but not RRSP income, it would appear that many people are missing out on this credit by not rolling at least some of their RRSP assets into a RRIF or annuity at age 65.
While some may be missing out on the pension income credit, it appears that many others are taking advantage of a different tax-saving opportunity.
The “elected split-pension” option allows a spouse to transfer some of their pension income to their partner, in order to reduce their combined tax liability. As you can see in the table (below), more than a million seniors were doing so in 2021, to the tune of $11,704 on average.
The CRA income stats also show healthy participation in investment markets but with one cautionary note: although almost two million people earned an average of $17,776 in dividend income from taxable Canadian corporations, only 1.63 million claimed a dividend tax credit on these earnings. In other words, many seniors are missing out on this significant tax break as well.
It appears that many other seniors—a combined 460,000 people, or seven per cent of the total—earned income from business, professional, farming, or fishing sources.
Although there may be a small overlap, if you add this total to those earning employment income, it means that as many as 1.5 million Canadians, or 21 per cent of all those 65 or older, were still out there working one way or another. Predictably, more than half—871,260—were in the 65 to 69 age group, representing almost 40 per cent of that cohort.
Finally, almost 2.5 million seniors were receiving net federal supplements, that is, primarily the Guaranteed Income Supplement (GIS). This would include most of the 2.8 million with non-taxable returns; the difference of 300,000 people likely reflects those whose incomes were low enough to be non-taxable but not quite low enough for them to collect GIS; the lowest-income half a million of these GIS recipients also received social-assistance payments.
Selected Income Sources Among Seniors, 2021 Taxation Year
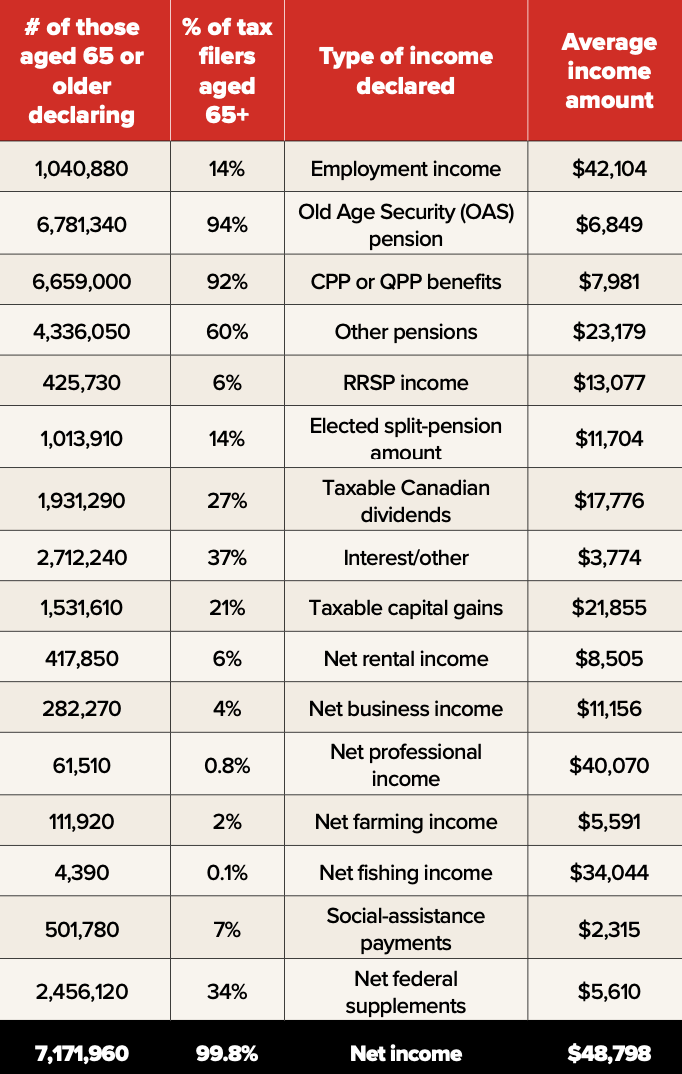
This table shows the number of Canadians aged 65 or older (column 1) and the percentage of the total 7.2 million of this age cohort (column 2) who declared the listed types of income (column 3) on their 2021 tax returns. Note that this is not an exhaustive list but shows only the largest, or in some cases most interesting, income sources for retirees. Column 4 shows the average amounts of each type of income declared by the number of people in column 1. The missing 0.2 per cent who reported no net income reflects statistical anomalies from rounding.
Source: Canada Revenue Agency Income Statistics


